

Class-A Surfacing Study: When Five Surfaces Look the Same, But Aren't

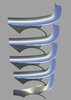
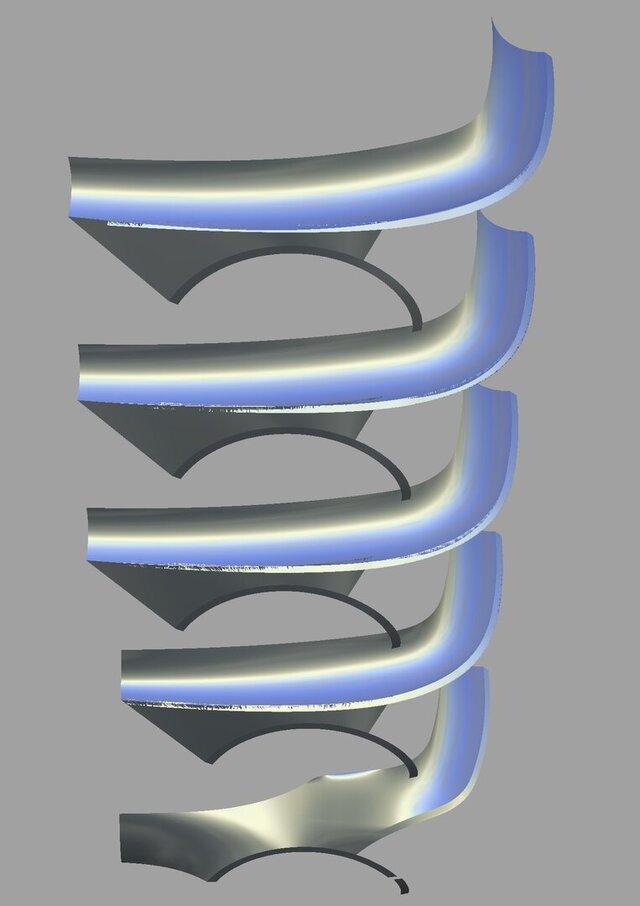
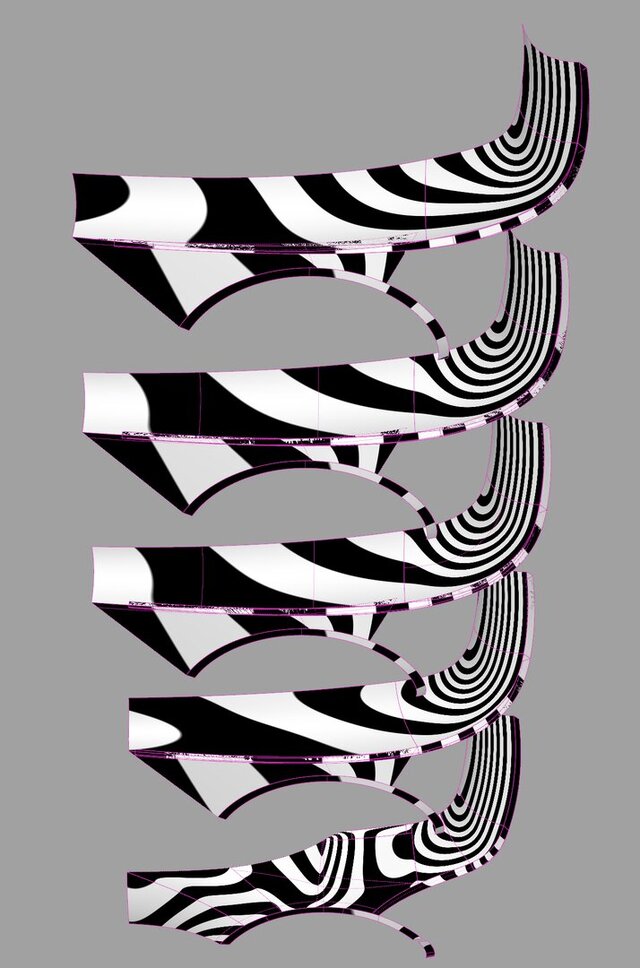
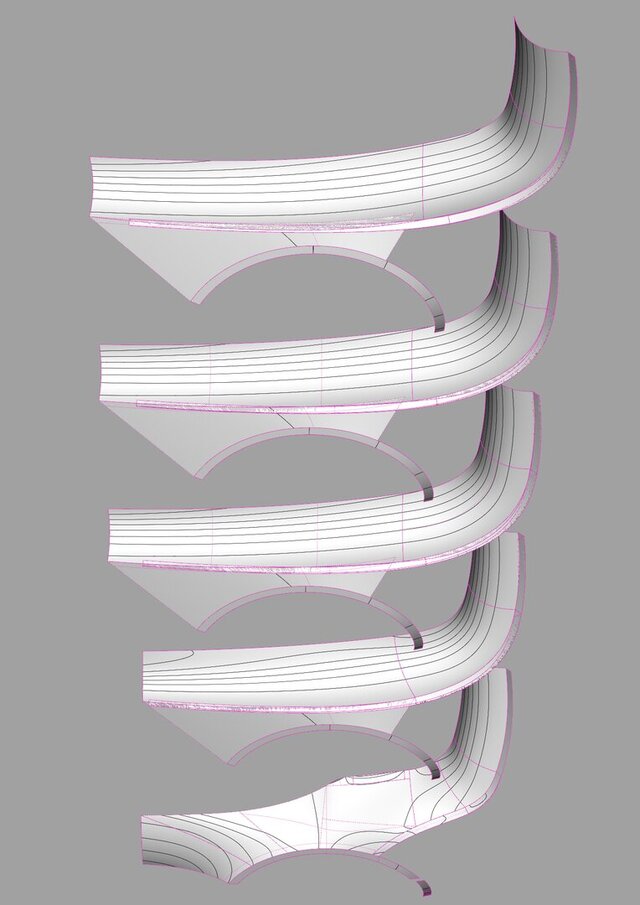
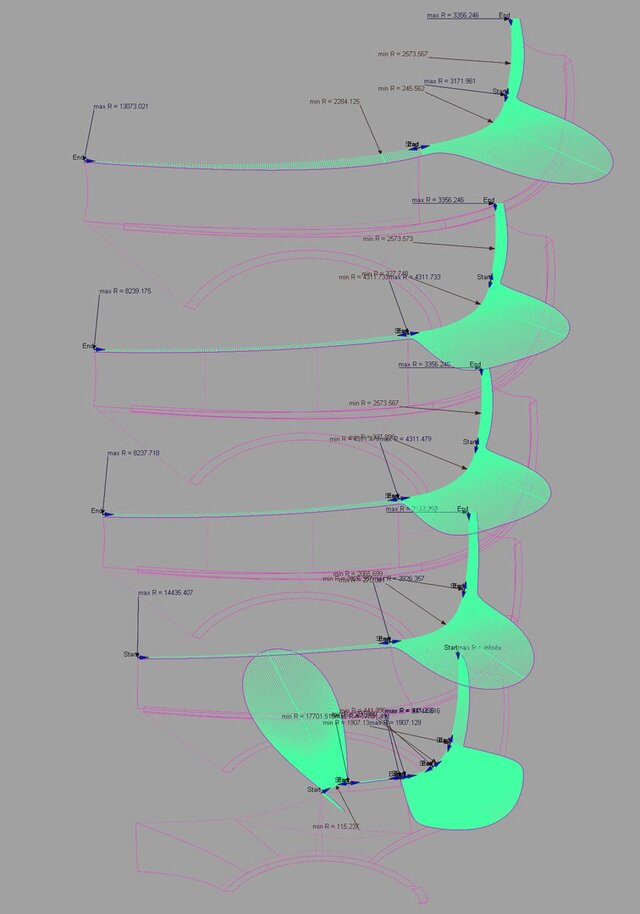
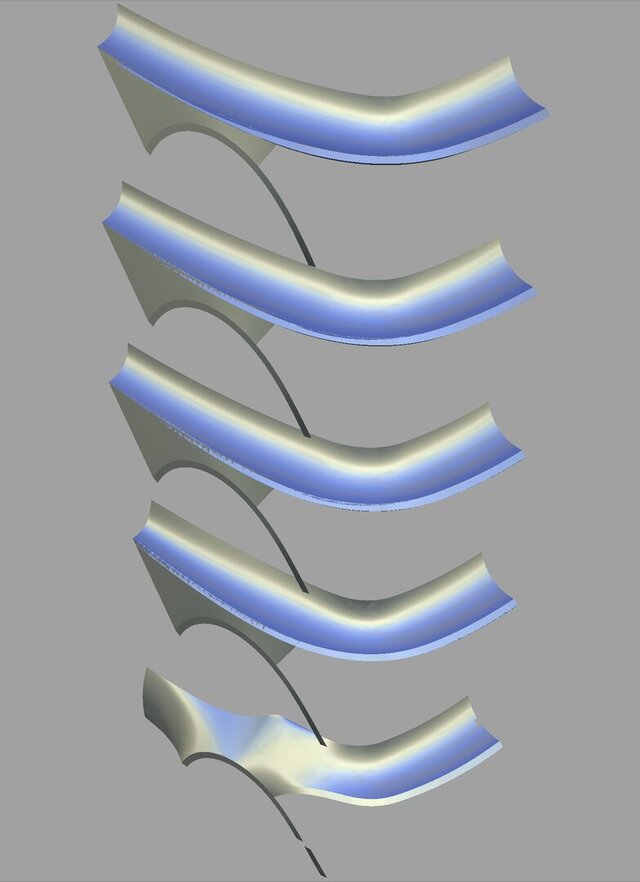
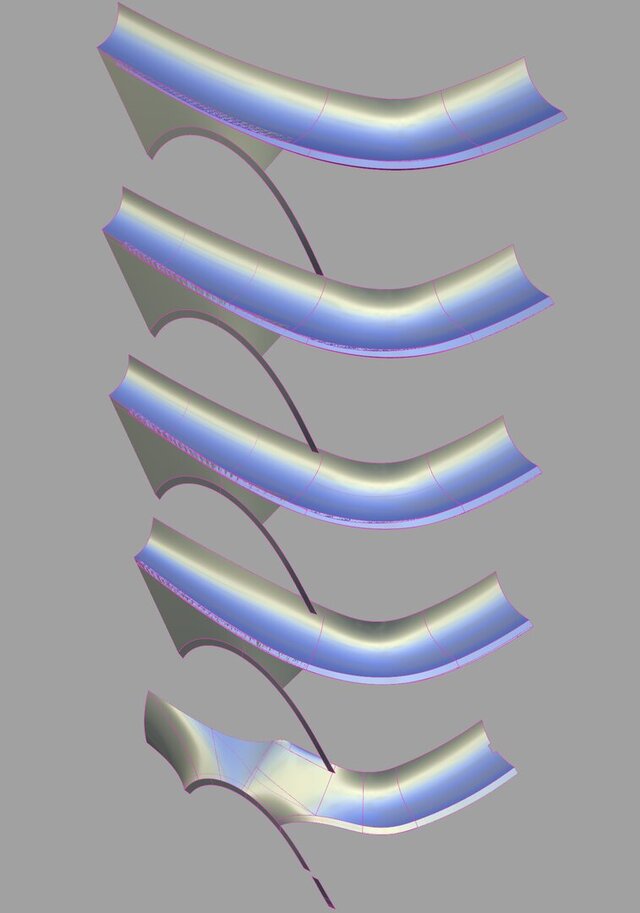
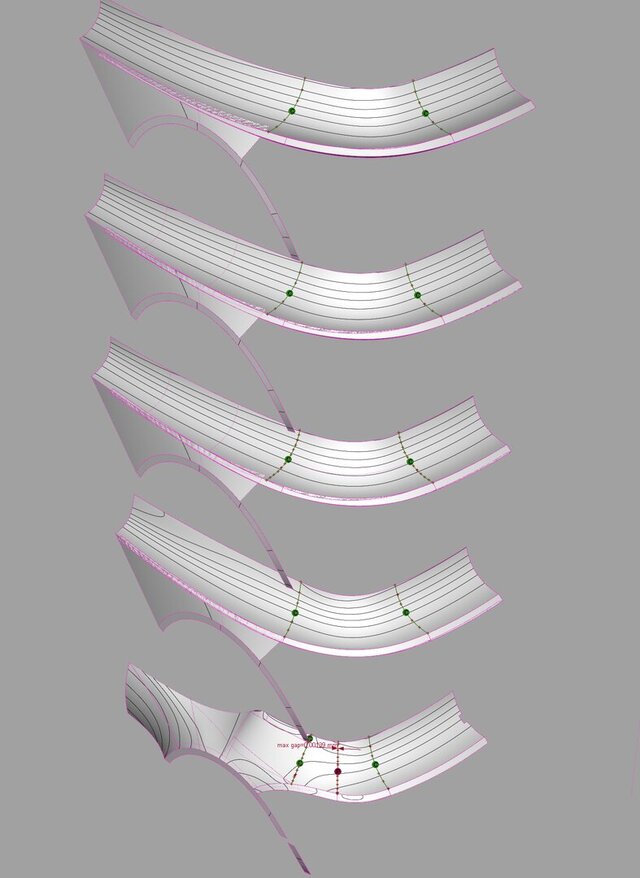
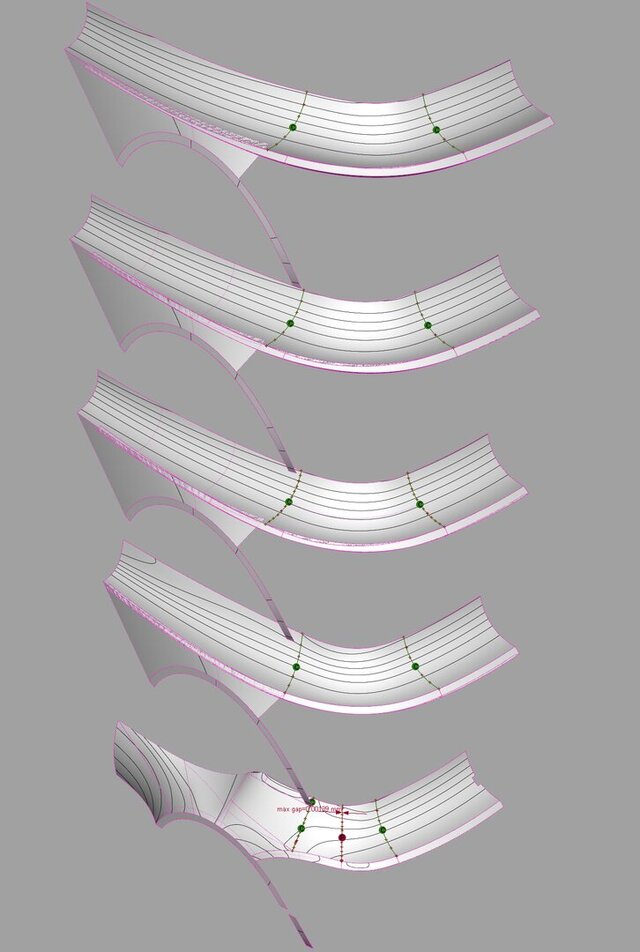
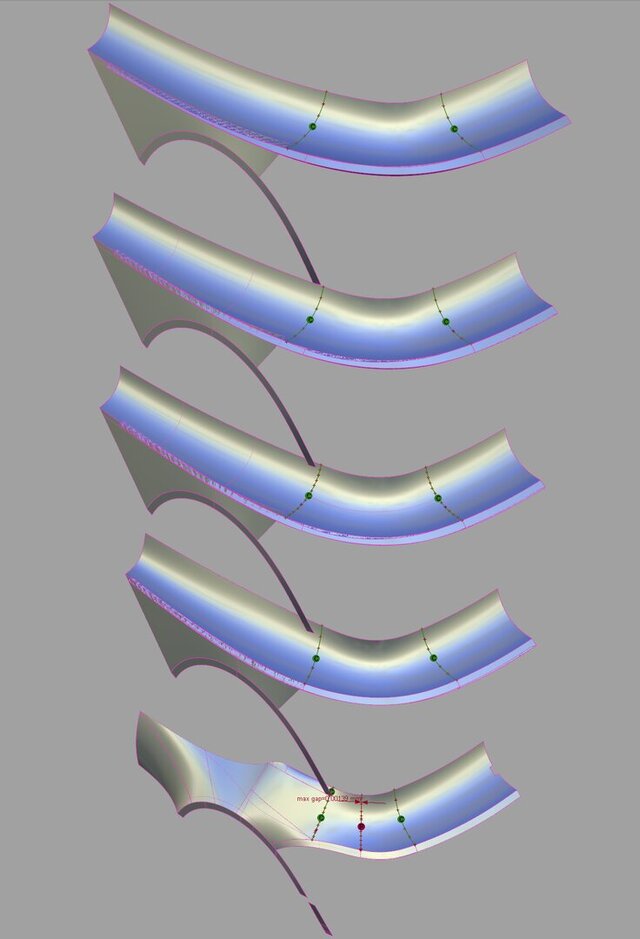
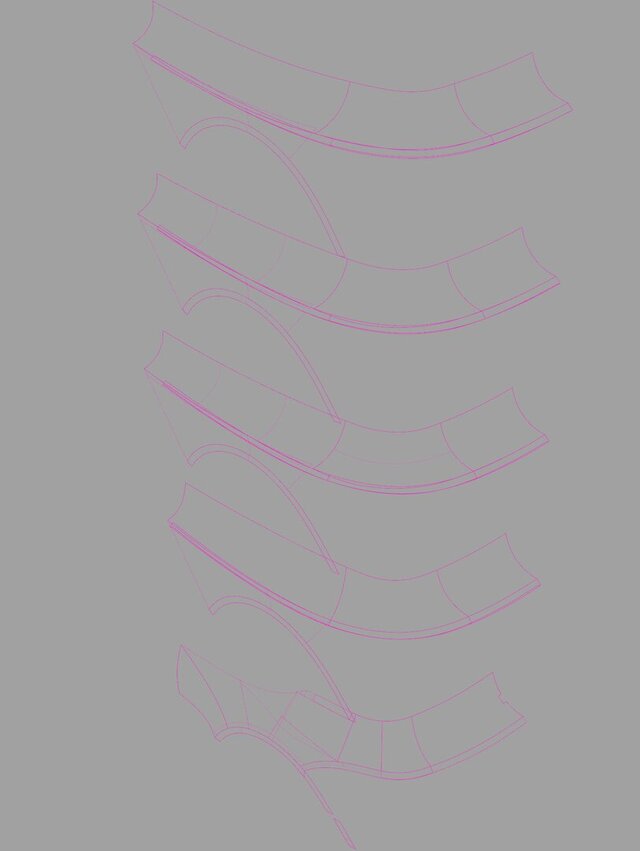
At first glance, the five surfaces shown appear almost identical, and most designers, engineers, or 3D modeling software users would likely consider them equivalent.
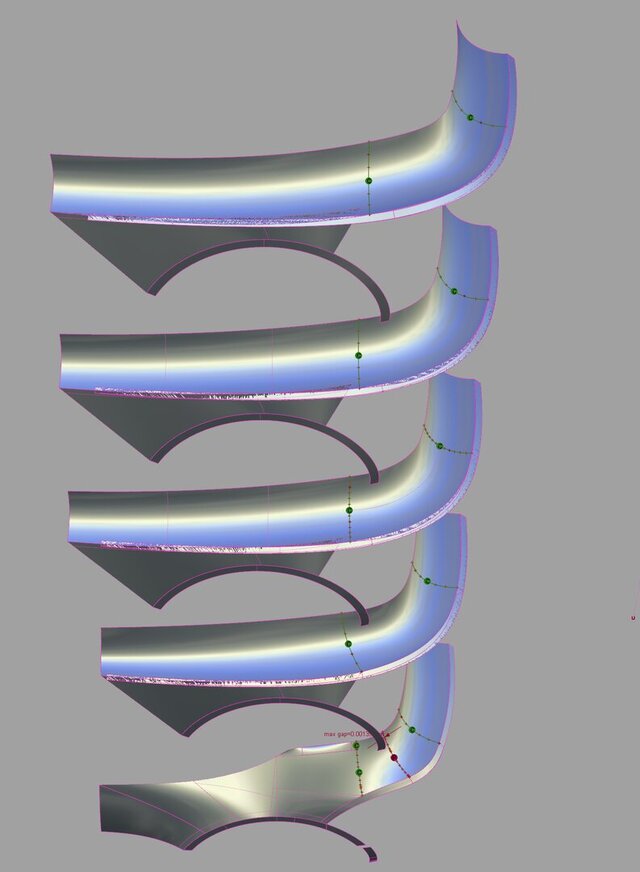
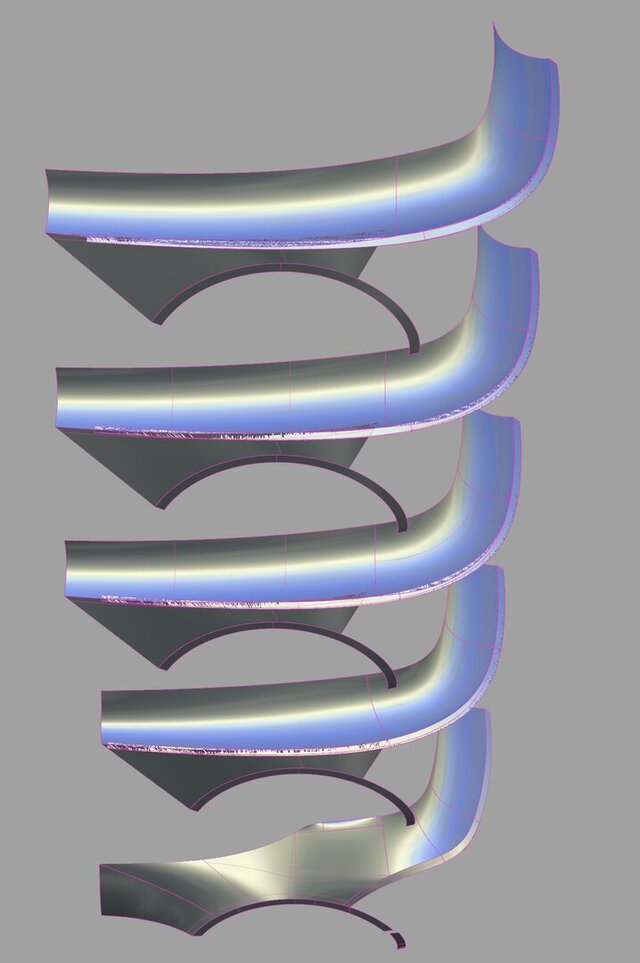
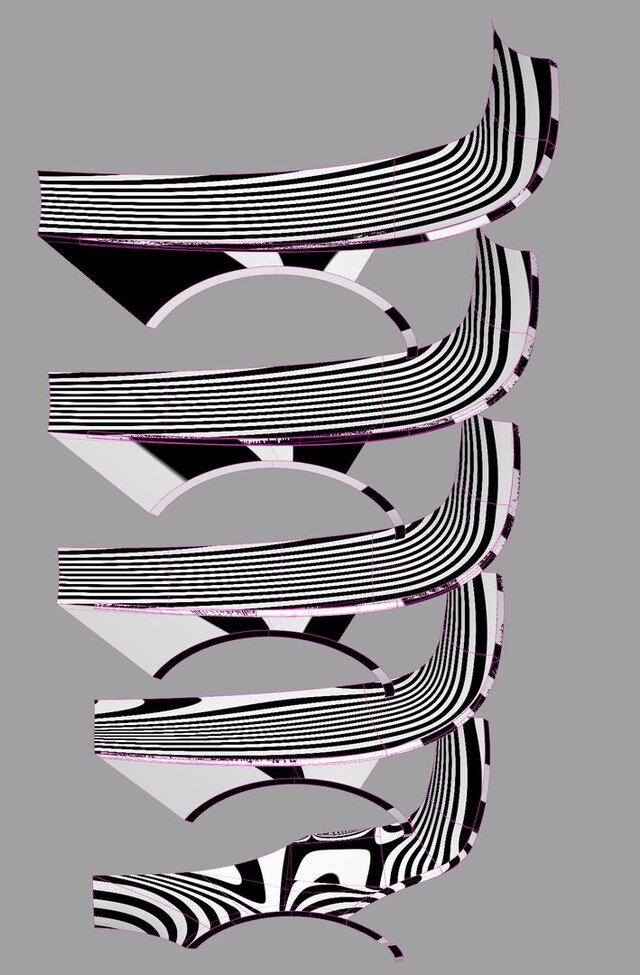
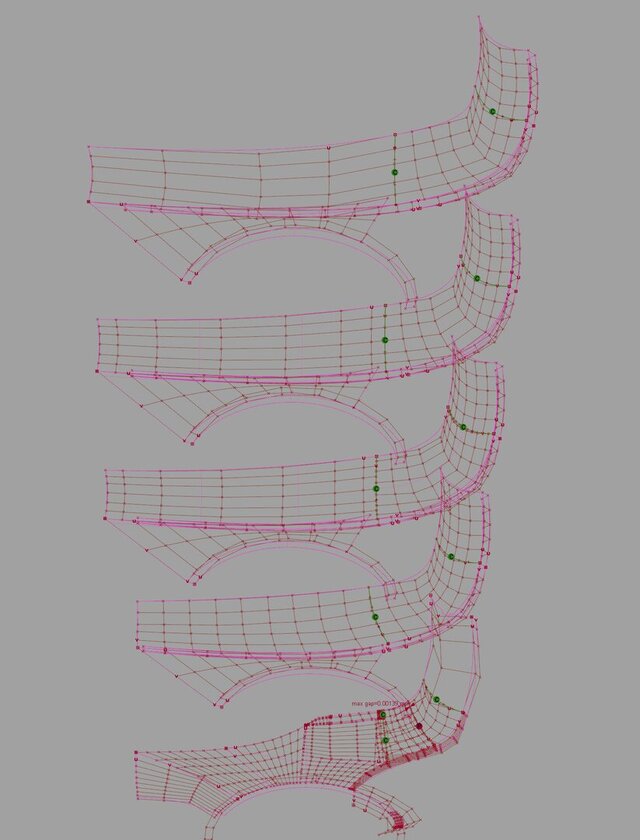
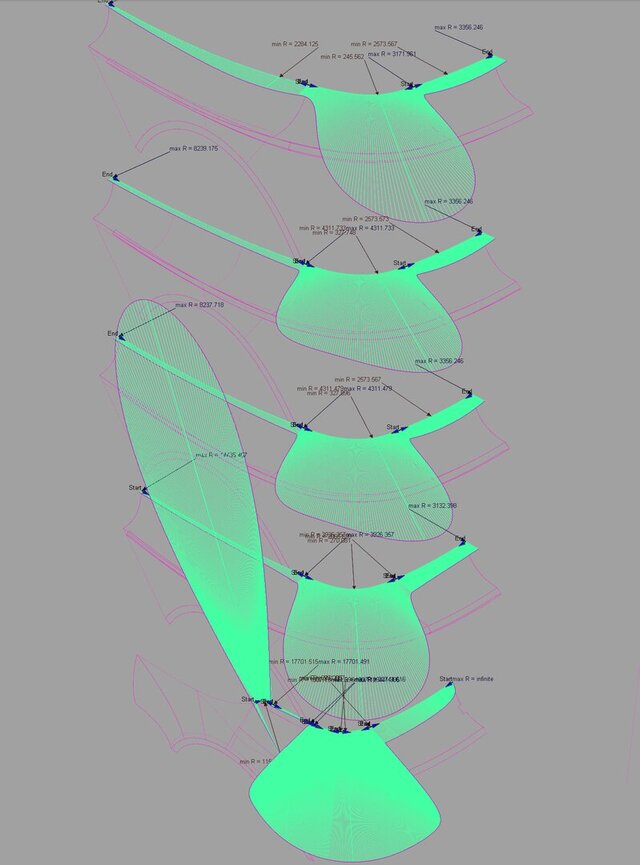
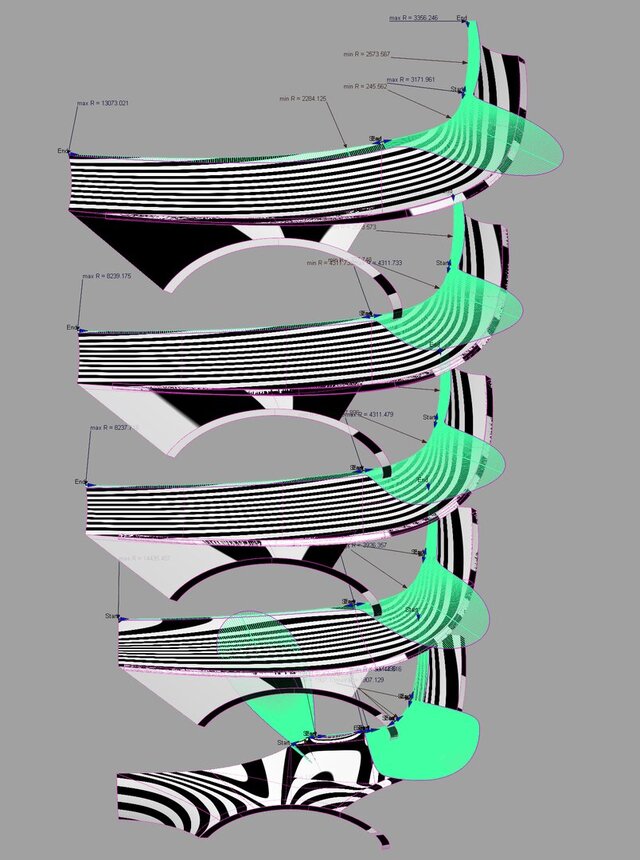
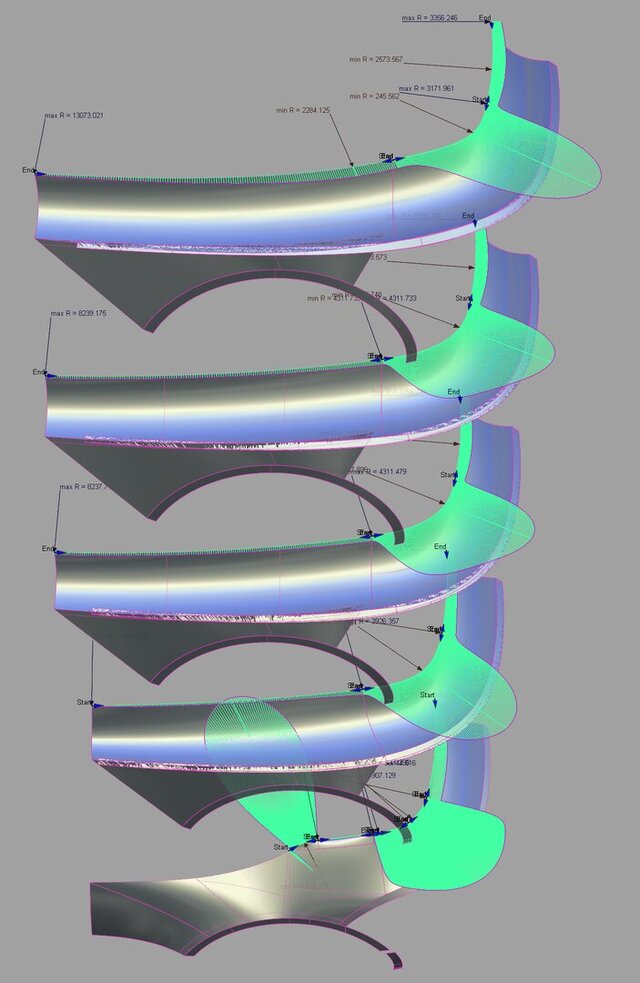
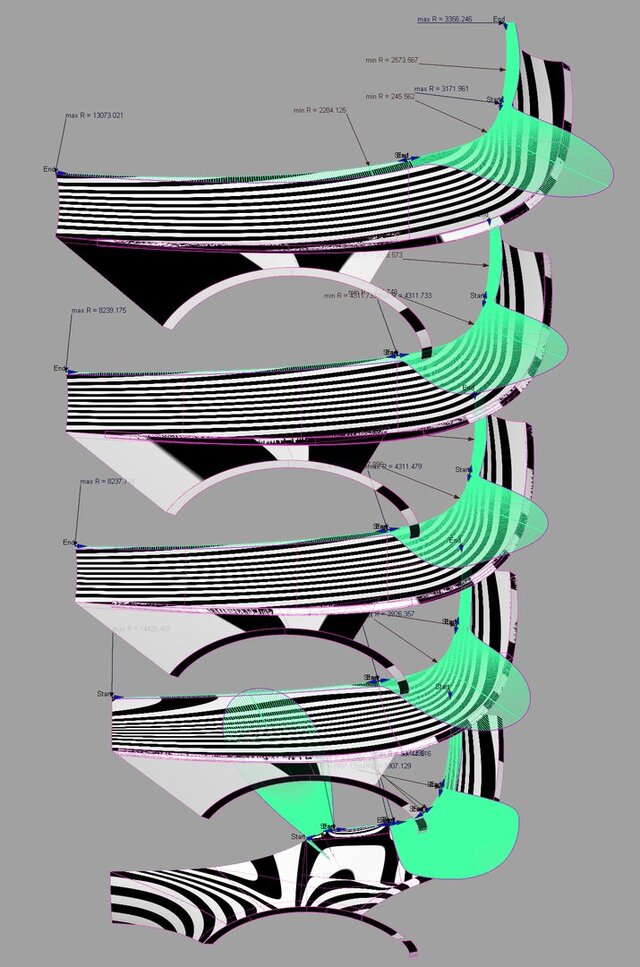
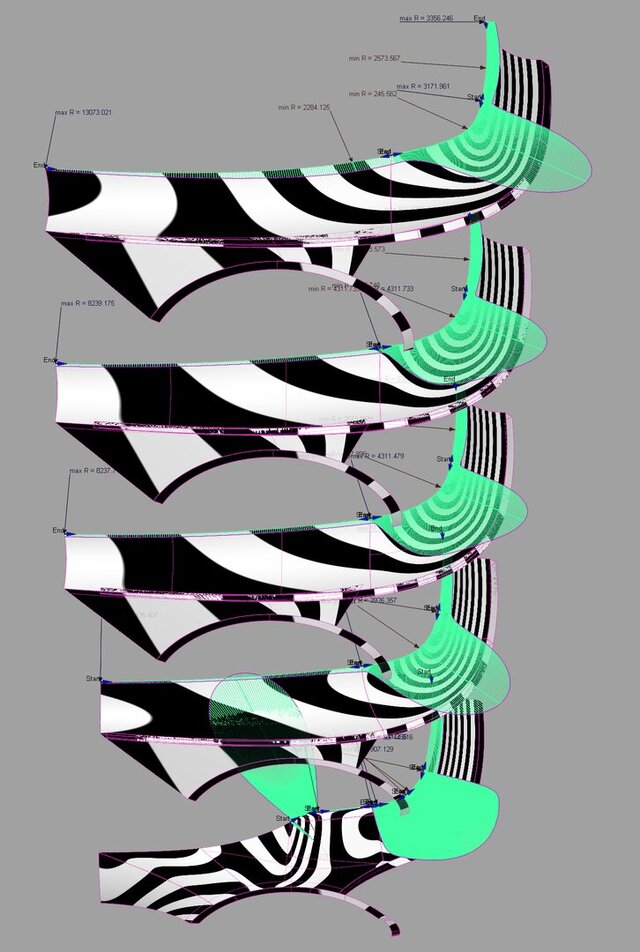
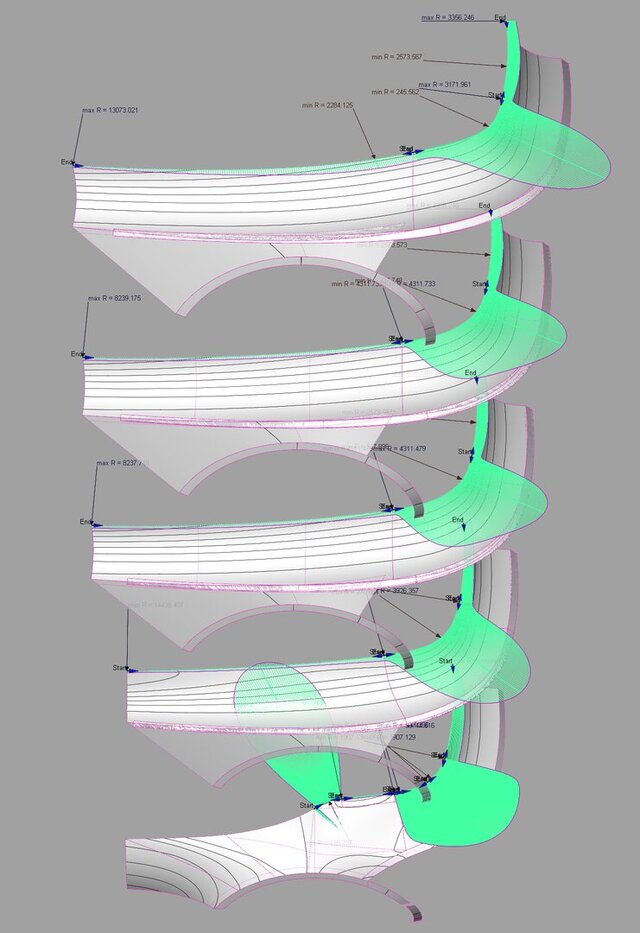
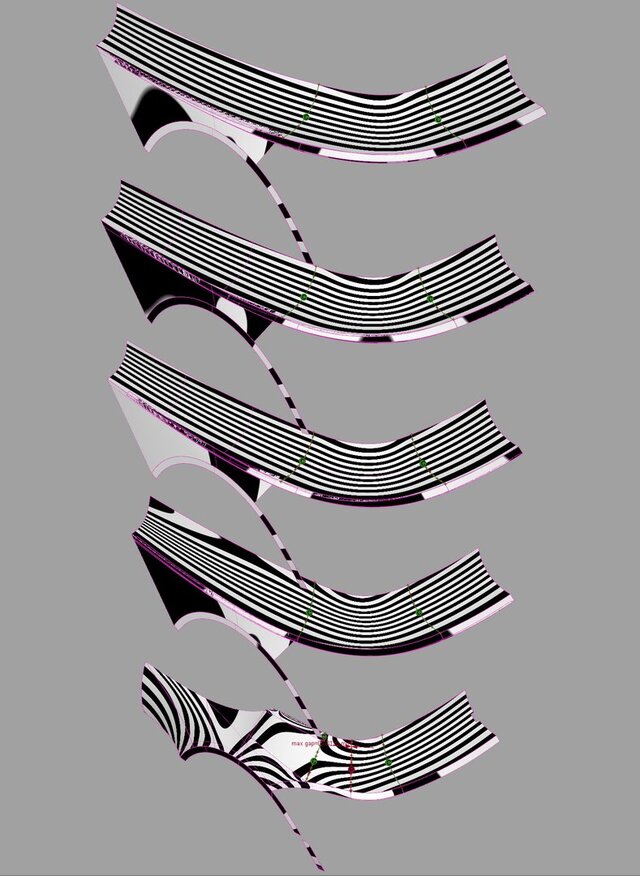
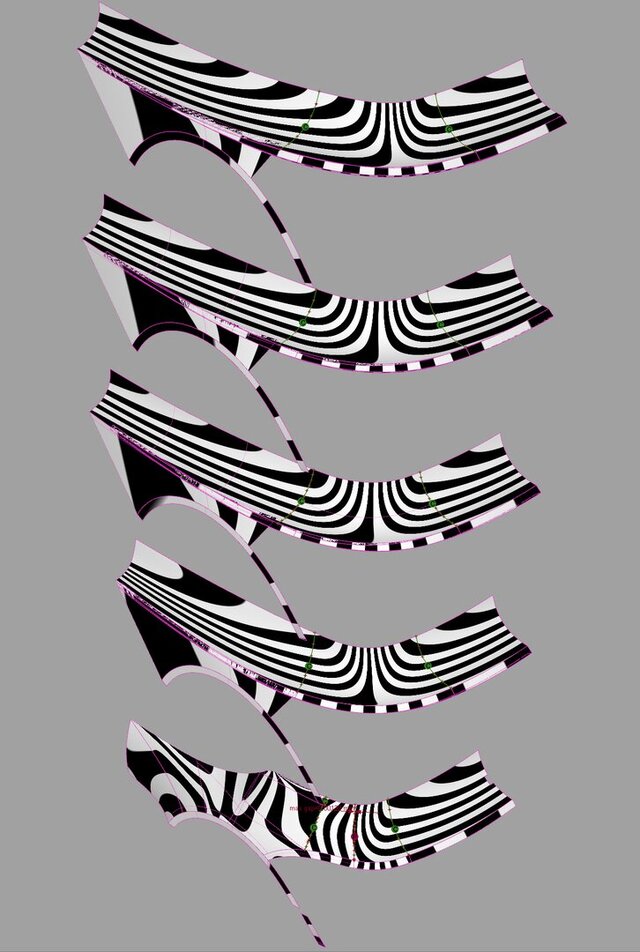
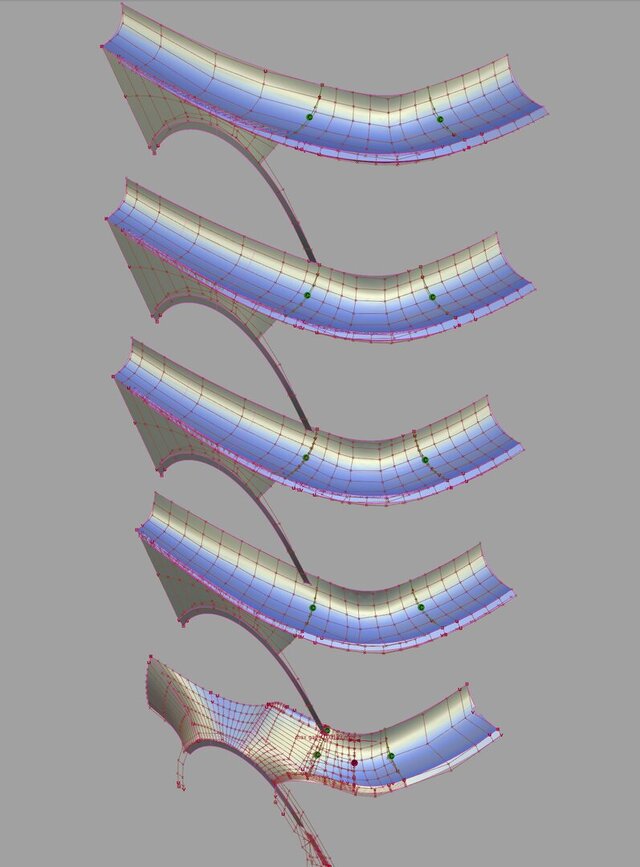
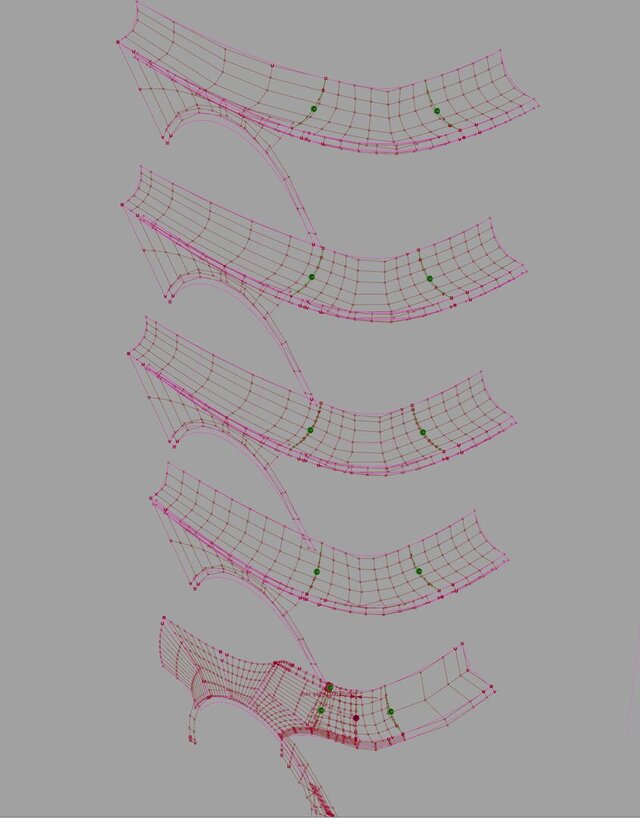
However, when evaluated with Class‑A analysis tools such as Zebra Stripes, Reflection Lines, Curvature Combs, Surface Curvature Analysis, Draft Shading, CV Structure Evaluation, and others, notable differences emerge.
While the visible shape changes very little from one iteration to the next, the reflective behavior, fairness, curvature distribution, and overall surface maturity steadily improve from A to E (bottom to top).
The goal of this analysis was not to alter the design, but to enhance how light interacts with it.
Surface score results show:
A – 70/100 CAS/Development Stage
B – 89/100 Good Class‑A
C – 93/100 Strong Class‑A
D – 95/100 High‑End Class‑A
E – 96/100 Best Overall Result.
Good Class‑A surfacing is about controlling light movement across the shape, where even a few control‑point adjustments can dramatically impact perceived quality while keeping the design essentially unchanged. In production, customers don’t see CVs, G2, G3 values, or curvature graphs; they see reflections.
If your project needs Class‑A surfacing, Autodesk Alias modeling, CAS‑to‑Class‑A development, surface quality improvement, or reflection analysis and optimization, feel free to reach out.
Published